Social media remains the heartbeat of digital marketing, and understanding your performance across platforms has never been more crucial.
With algorithms constantly shifting and new features launching regularly, businesses that track their social media analytics effectively gain a significant competitive advantage.
This comprehensive guide walks you through everything you need to know about analytics for social media in 2026, from setting clear objectives to optimising your strategy based on data-driven findings.
Why Social Media Analytics Still Matters in 2026
Analytics for social media can help transform raw numbers into actionable insights that guide your business strategy and measure return on investment across all platforms.
Rather than posting content and hoping for the best, analytics help you set marketing goals that align with broader business objectives like engagement, conversions, client retention, and pipeline contribution.
Measuring performance across established platforms like Instagram, Facebook, LinkedIn, and X provides a comprehensive view of your digital presence.
Each platform serves different audience segments and content goals, making cross-platform analytics essential for understanding your complete social media impact.
Get Your FREE Social Media Strategy Template Here →
Your Step-by-Step Analytics Framework
Step 1: Set Clear Objectives
Before examining any metrics, you must define what success looks like for your specific business situation. This step forms the foundation of your entire analytics strategy because without clear objectives, you’ll find yourself drowning in data without actionable direction.
When setting your objectives, consider what matters most for your business right now.
Engagement focuses on building meaningful interactions with your audience through likes, comments, shares, and saves—perfect if you’re looking to build community and foster relationships. Conversions drive specific actions like email sign-ups, downloads, purchases, or demo requests, making this ideal when you need measurable business outcomes. If you’re expanding into new markets or launching new products, reach becomes crucial as it focuses on growing your audience and increasing brand visibility across target demographics.
Brand awareness objectives work well for newer businesses or those entering competitive markets, as they improve recognition and recall of your brand among potential clients.
Clear objectives transform social media from a “nice-to-have” marketing activity into a measurable business driver. When you align your social media goals with broader business objectives, every post, comment, and interaction becomes a strategic move toward revenue growth, brand positioning, or market expansion.
Step 2: Choose the Right Platforms
Different platforms serve different purposes and audiences. Matching your platform selection to your audience demographics and content goals ensures maximum return on your social media investment.
Understanding where your audience spends their time is crucial for platform selection.
Instagram excels in visual storytelling and reaches younger demographics particularly well, especially those aged 18-34. The platform works brilliantly for product showcases, behind-the-scenes content, and brand lifestyle messaging, while its shopping features make it indispensable for e-commerce businesses.
Facebook provides the broadest demographic reach and offers the most sophisticated targeting options available. Its diverse content formats support everything from simple text updates to complex multimedia campaigns and event promotion, making it suitable for most business types, particularly those targeting audiences over 25.
LinkedIn dominates professional networking and becomes essential for B2B companies, professional services, and anyone looking to establish thought leadership. This platform excels when you need to reach decision-makers, share industry insights, and build meaningful professional relationships.
X serves as the real-time conversation hub where news breaks and trends emerge. Its fast-paced nature makes it perfect for timely updates, industry commentary, and direct client communication, though success here requires consistent engagement and quick responses to trending conversations.
Consider your audience’s platform preferences, your content creation capabilities, and your business objectives when selecting which platforms to prioritise.
Step 3: Use Native Analytics Tools
Each platform provides built-in analytics tools that offer the most accurate, real-time data about your performance. Native tools update immediately when algorithms change and provide platform-specific insights that third-party tools often miss.
For instance:
- Instagram Insights (available for business accounts) provides comprehensive data about your audience demographics, content performance, and account activity. Access detailed metrics for posts, stories, reels, and IGTV content, plus audience insights that help refine your targeting strategy.
- Meta For Business combines analytics for both Facebook pages and Instagram accounts, offering cross-platform insights and unified reporting. Track page performance, ad results, and audience engagement across Meta’s platforms from one dashboard.
- LinkedIn Analytics offers separate dashboards for personal profiles and company pages. Monitor follower demographics, content engagement, and visitor actions. LinkedIn’s unique professional context provides insights into job titles, industries, and company sizes within your audience.
- X Analytics provides data about post performance, audience insights, and account activity. Track impressions, engagement rates, and follower growth, plus detailed information about your most successful content themes and posting times.
These native tools provide the foundation for accurate measurement and should be your primary data source for each platform.
Step 4: Track the Right Metrics
Engagement rate serves as one of the most telling metrics because it measures the percentage of your audience that actively interacts with your content. You can calculate this by dividing total engagements, such as likes, comments, shares, and saves, by your total followers or reach, depending on what you’re trying to achieve.
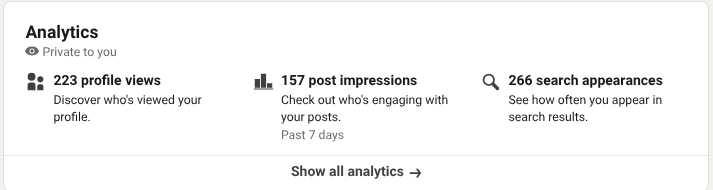
Reach and impressions work together to show your content’s visibility potential. Reach tells you how many unique users see your content, while impressions count total content views.
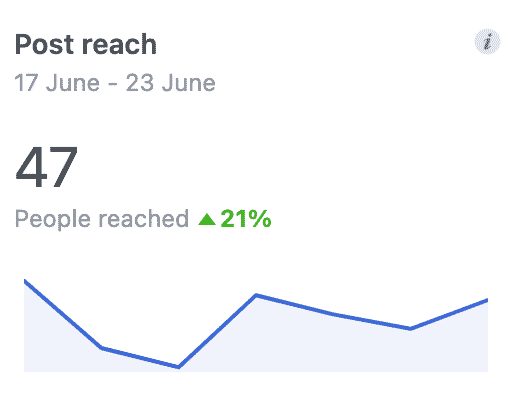
Understanding both helps you gauge whether your content resonates widely or if the same people are seeing it multiple times.
Click-through rates prove particularly valuable because they measure how effectively your social media content drives traffic to your website, landing pages, or other desired destinations. This metric creates a direct connection between your social media activity and actual lead generation or sales opportunities.
Follower growth tracking goes beyond simple numbers by monitoring both the rate of audience expansion and the quality of new followers. You want to ensure you’re attracting your target demographic rather than just accumulating random accounts that won’t engage with your business.
Conversion metrics deserve special attention because they measure specific actions users take after engaging with your social media content. Whether you’re tracking email sign-ups, download completions, purchase completions, or any other actions that align with your business objectives, these metrics directly demonstrate ROI.
Content performance analysis by type helps identify which formats work best for your specific audience and objectives.
Step 5: Analyse the Data
Raw metrics become valuable business intelligence only when you analyse patterns, identify trends, and connect social media activities to business outcomes.
Key Analysis Areas:
- Trend Identification involves looking for patterns in your data over time. Are engagement rates increasing or decreasing? Which content themes consistently perform well? When do your audiences engage most actively?
- Content Performance Assessment means comparing different content types, topics, and formats to identify your most effective approaches. Analyse which posts drive the most engagement, clicks, and conversions to inform future content creation.
- Timing Analysis helps to optimise your posting schedule by identifying when your audience is most active and responsive. Different platforms and audiences have varying peak activity times.
- Audience Insights reveal demographics, interests, and behaviours of your most engaged followers. Use this information to refine your targeting and create more relevant content.
- Competitive Benchmarking involves comparing your performance to industry standards and direct competitors to identify opportunities for improvement.
Look for correlations between different metrics.
For example, does higher engagement lead to increased website traffic? Do certain hashtags improve reach? Understanding these connections helps optimise your overall strategy.
Step 6: Optimise Based on Findings
Data analysis only creates value when you act on the insights to improve your social media performance. This optimisation phase involves making strategic adjustments based on what your analytics reveal about audience preferences and content effectiveness.
Transforming your data insights into improved performance requires strategic action based on what your analytics reveal about audience preferences and content effectiveness.
Start by adjusting your posting schedule based on when your audience shows the highest levels of activity and engagement. If your analytics consistently show better engagement rates during specific hours or days, shifting your posting schedule to maximise visibility during these peak times can significantly improve your results without any additional effort or budget.
Refining your content mix means increasing production of your best-performing content types while reducing or eliminating formats that consistently underperform.
Step 7: Report and Reflect
Regular reporting transforms your social media analytics into actionable business intelligence that guides strategic decisions and demonstrates social media ROI to you as the business owner.
Reporting Best Practices:
- Monthly Reports should highlight key performance indicators, content successes, and areas for improvement. Include metrics that directly relate to your stated objectives and business goals.
- Campaign-Based Reports provide detailed analysis of specific campaigns or content series, measuring performance against stated objectives and budget allocation.
- Dashboard Creation using built-in platform tools or spreadsheets helps visualise trends and makes data more accessible to stakeholders who need regular updates but don’t require detailed analytics knowledge.
- Quarterly Reviews offer opportunities for strategic reflection and planning adjustments based on longer-term trends and seasonal patterns.
Include both quantitative metrics and qualitative insights in your reports. Numbers tell part of the story, but context about audience feedback, industry changes, and competitive landscape provides a complete understanding.
Here’s what some social media analytics examples could look like from different social media channels:
- Instagram Reporting Example: Track post engagement rates alongside reach and save rates for your top-performing content. Note that educational posts about industry insights generated 40% more website clicks than promotional posts. Record how behind-the-scenes content featuring your team and processes achieved three times higher engagement than generic stock photo posts.
- Facebook Reporting Example: Monitor page reach versus engagement rates to identify your most effective posting times. Document that industry tip posts generated 25% more shares than company news updates. Track how event promotion posts drove actual attendance numbers and measure conversion from Facebook leads to email subscribers.
- LinkedIn Reporting Example: Analyse which industry-focused articles generated the most profile views and connection requests from your target job titles. Report that thought leadership posts received 60% more shares than company updates. Measure how LinkedIn-generated leads convert to sales meetings compared to other channels.
- X Reporting Example: Track hashtag performance during trending conversations and measure how thread posts perform versus single posts. Note that responding to industry news within two hours generates five times more reposts than delayed responses. Record which client service interactions on X prevented escalations and maintained brand reputation.
Join a Demo and Tick Social Media Off Your To-Do List From £100/mo →
Best Practices for 2026
Here are the key points to keep in mind as you create social media content, while considering your analytics.
Maintain Consistency in Branding and Voice
Consistency across platforms builds trust because your audience develops familiarity with your brand’s personality and messaging style. This doesn’t mean posting identical content everywhere—rather, it means adapting your core brand voice to fit each platform’s culture while maintaining recognisable elements like colour schemes, logo usage, and key messaging points.
A financial services company might use more formal language on LinkedIn while adopting a friendlier tone on Instagram, but its commitment to transparency should remain consistent. Inconsistent branding confuses audiences and weakens your marketing impact by forcing you to rebuild brand recognition on each platform.
Focus on Meaningful Engagement Over Vanity Metrics
A community of 5,000 highly engaged followers provides far more business value than 50,000 passive followers who never interact. Comments represent the highest quality engagement because they demonstrate genuine interest and create opportunities for conversation that often lead to sales enquiries.
Shares extend your reach to audiences who trust the person sharing your content, providing implicit endorsement that’s more valuable than paid advertising. Focus your analytics on engagement rates and conversion metrics rather than follower counts that don’t correlate with business outcomes.
Stay Compliant With Privacy Regulations
Privacy compliance protects your business from legal penalties while building trust with privacy-conscious consumers. Be explicit about what data you collect through social media analytics and provide clear opt-out options where required.
Before featuring client posts in your marketing materials, obtain explicit permission. Consider privacy compliance an opportunity to build trust—brands that proactively communicate about privacy protection often see higher engagement rates.
Keep Updated on Platform Changes
Social media platforms constantly evolve their algorithms and introduce new features.
Follow official platform blogs and industry newsletters to stay ahead of changes. New analytics features often provide optimisation opportunities before they become widely available, giving early adopters competitive advantages.
Key Takeaways
Social media analytics remain essential for informed decision-making and measuring marketing success. Without consistent measurement, you’re essentially flying blind in an increasingly competitive digital environment.
Focus on metrics that align with your business goals rather than getting distracted by numbers that don’t drive real results. Quality metrics that connect to business outcomes provide more value than impressive-looking vanity metrics.
Native analytics tools provide the most accurate, platform-specific data available. While third-party tools offer convenience and cross-platform views, native platforms give you the most complete and timely information.
Regular analysis and optimisation lead to improved performance over time. Social media success requires ongoing attention and adjustment rather than set-and-forget strategies.
Data-driven decisions consistently yield better long-term results than gut-feeling approaches. Let your analytics guide your content strategy, posting schedule, and platform priorities.
Next Steps
Developing and acting on the right social media analytics examples can be time-consuming for busy business owners—but you don’t have to do it alone.
100 Pound Social is your solution. With our extensive knowledge and proven expertise, our UK-based team offers cost-effective, high-quality social media content and management for all your marketing needs.
Looking to get started on your social media marketing plan but not sure where to begin? Check out 100 Pound Social’s £100 Posts Plan and let us create expert social media content for you from just £100 per month.
This plan includes three social media posts per week to your chosen platforms (LinkedIn, Facebook, X, Google Business Profile, and Instagram), plus all of our plans come with a 20-day money-back guarantee.
As a result of working with us, our clients report increasing turnover, social media followers, and signing new clients.
Join a free 15-minute demo, or book a call, to find out how we can help you create the best social media content and analytics strategy for your business.